Examples
After installing colorir, example applications can be executed from the shell with:
$ python -m colorir <app>
Where app is one of:
Custom palettes for plotting
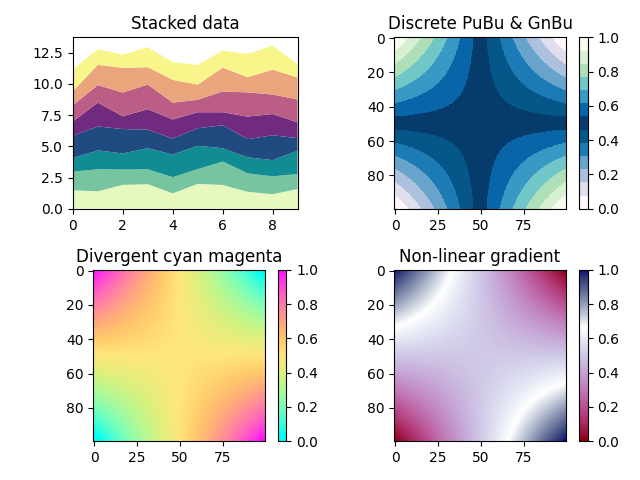
In this example we will use colorir to create custom color palettes and gradients and then use them to plot some data.
import numpy as np
import matplotlib.pyplot as plt
from colorir import *

fig, axes = plt.subplots(2, 2)
imdata = (np.outer(np.linspace(-1, 1, 100), np.linspace(-1, 1, 100)) + 1) / 2
cs = Palette.load()  # Load all colors available

# Discrete colormap from palette
pal = StackPalette.load("carnival").resize(8)  # Load the palette and resize it to get 8 color categories
ys = [np.random.random(10) + 1 for i in range(len(pal))]
axes[0, 0].stackplot(np.arange(10), *ys, colors=pal)
axes[0, 0].set_title("Stacked data")

# Discrete PuBu & GnBu
pubu = StackPalette.load("pubu")
gnbu = StackPalette.load("gnbu")
# Fuse palettes with the & operator
pal = pubu & gnbu[::-1]
# Make a discrete gradient from the palette
grad = Grad(pal.resize(13), discrete=True)
im1 = axes[0, 1].imshow(imdata, cmap=grad.to_cmap())
axes[0, 1].set_title("Discrete PuBu & GnBu")

# Divergent purple and yellow gradient
grad = PolarGrad([cs.cyan, cs.eggyolk, cs.magenta])
im2 = axes[1, 0].imshow(imdata, cmap=grad.to_cmap())
axes[1, 0].set_title("Divergent cyan magenta")

# Non-linear gradient
# Place the white closer to the end of the gradient instead of in the middle by setting 'color_coords'
grad = PolarGrad([cs.darkred, cs.white, cs.darkblue], color_coords=[0, 2 / 3, 1])
im3 = axes[1, 1].imshow(imdata, cmap=grad.to_cmap())
axes[1, 1].set_title("Non-linear gradient")

# Make stuff look good
axes[0, 0].set_aspect(1/2)
axes[0, 0].set_xlim([0, 9])
plt.colorbar(im1)
plt.colorbar(im2)
plt.colorbar(im3)

fig.tight_layout()
plt.show()
Color Wheel with Kivy
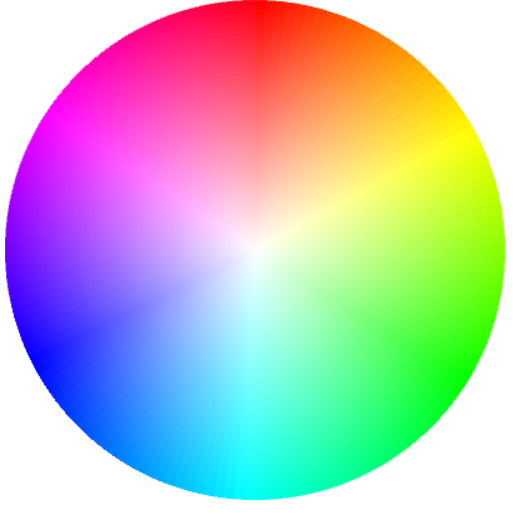
A color wheel viewer (not a color picker) showcasing Grad.
from kivy.config import Config
Config.set('graphics', 'width', '400')
Config.set('graphics', 'height', '400')
from kivy.app import App
from kivy.graphics import Ellipse, Rectangle, Color
from kivy.uix.widget import Widget
from colorir import config, KIVY_COLOR_FORMAT, Grad, HSV

# Define the default color format to work with kivy
config.DEFAULT_COLOR_FORMAT = KIVY_COLOR_FORMAT

# You can play around with these variables to change the appearance of the color wheel
ELLIPSE_STEPS = 150
ELLIPSE_SEGMENTS = 50


class WheelScreen(Widget):
    def __init__(self, **kwargs):
        super().__init__(**kwargs)

        iter_angle = 360 / ELLIPSE_STEPS
        with self.canvas:
            Rectangle(pos=(0, 0), size=(400, 400))  # Draw background

            for j in range(ELLIPSE_SEGMENTS + 1):
                s = 1 - j / ELLIPSE_SEGMENTS
                # Sample colors throughout the hue range for this saturation
                outer_colors = Grad(
                    [HSV(0, s, 1), HSV(355, s, 1)],
                    color_sys=HSV
                ).n_colors(ELLIPSE_STEPS)
                for i, color in enumerate(outer_colors):
                    Color(*color)
                    width = 400 * (ELLIPSE_SEGMENTS - j) / ELLIPSE_SEGMENTS
                    height = 400 * (ELLIPSE_SEGMENTS - j) / ELLIPSE_SEGMENTS
                    Ellipse(
                        pos=(200 - width / 2, 200 - height / 2),
                        size=(width, height),
                        angle_start=i * iter_angle,
                        angle_end=(i + 1) * iter_angle
                    )


class WheelApp(App):
    def build(self):
        return WheelScreen()


app = WheelApp()
app.run()
Palette Picker with Plotly
A plotly application used to test palettes with different data types.
import csv
import numpy as np
import plotly.graph_objs as go
from pathlib import Path
from plotly.io import templates as plotly_templates
from plotly.subplots import make_subplots
from colorir import *

palettes = {name: Palette.load(name).to_stackpalette() for name in find_palettes(kind=Palette) if name != "css"}
for name in find_palettes(kind=StackPalette):
    dict_name = name
    if name in palettes:
        dict_name += " (stack palette)"
    palettes[dict_name] = StackPalette.load(name)
palettes = {k: palettes[k] for k in sorted(palettes)}
max_pal_size = max(len(pal) for pal in palettes.values())
carnival = StackPalette.load("carnival")
carnival_colorscale = Grad(carnival).to_plotly_colorscale()

fig = make_subplots(
    4, 2,
    specs=[[{"type": "scatter"}, {"type": "violin"}],
           [{"type": "scatter"}, {"type": "contour"}],
           [{"type": "histogram"}, {"type": "surface"}],
           [{"type": "choropleth", "colspan": 2}, None]]
)

# We will refer to this list to determine how to restyle the trace when changing palettes
restyle = []
for i in range(max_pal_size):
    y = [i]
    for j in range(49):
        y.append(y[-1] + 2 * (np.random.random() - 0.5))
    fig.add_trace(go.Scatter(
        x=np.arange(50),
        y=y,
        line_width=1,
        marker_size=10,
        line_color=carnival[i % len(carnival)],
        marker_color=carnival[i % len(carnival)],
        showlegend=False,
        visible=i < len(carnival)
    ), row=1, col=1)
    restyle.append("dynamic_categ")

    fig.add_trace(go.Violin(
        x=np.random.standard_normal(20) - i / 2,
        y0=max_pal_size - i,
        orientation='h',
        side="positive",
        width=3,
        line_color=carnival[(max_pal_size - i) % len(carnival)],
        showlegend=False,
        visible=i < len(carnival),
        hoverinfo="skip"
    ), row=1, col=2)
    restyle.append("dynamic_categ")

locations = []
pop = []
lifeexp = []
gdppercapita = []
with open(Path(__file__).parent / "gapminder.csv") as file:
    for row in csv.DictReader(file.read().split("\n")[:-1]):
        locations.append(row["iso"])
        pop.append(int(row["pop"]))
        lifeexp.append(float(row["lifeExp"]))
        gdppercapita.append(float(row["gdpPercap"]))
fig.add_trace(go.Scatter(
    x=gdppercapita,
    y=lifeexp,
    mode="markers",
    marker=go.scatter.Marker(
        size=pop,
        sizemode="area",
        sizeref=max(pop) / 3600,
        color=np.random.choice(np.array(carnival), size=len(pop))
    ),
    showlegend=False
), row=2, col=1)
restyle.append("static_categ")
fig.update_xaxes(type="log", row=2, col=1)

fig.add_trace(go.Contour(
    z=[[None, None, None, 12, 13, 14, 15, 16],
       [None, 1, None, 11, None, None, None, 17],
       [None, 2, 6, 7, None, None, None, 18],
       [None, 3, None, 8, None, None, None, 19],
       [5, 4, 10, 9, None, None, None, 20],
       [None, None, None, 27, None, None, None, 21],
       [None, None, None, 26, 25, 24, 23, 22]],
    connectgaps=True,
    colorscale=carnival_colorscale,
    showscale=False,
), row=2, col=2)
restyle.append("colorscale")

fig.add_trace(go.Histogram2d(
    x=np.concatenate([np.random.beta(4, 2, 100000), np.random.beta(2, 4, 100000)]),
    y=np.concatenate([np.random.beta(4, 2, 100000), np.random.beta(2, 4, 100000)]),
    nbinsx=50,
    nbinsy=50,
    colorscale=carnival_colorscale,
    showscale=False
), row=3, col=1)
restyle.append("colorscale")
fig.update_xaxes(constrain="domain", row=3, col=1)
fig.update_yaxes(scaleanchor="x5", scaleratio=1, row=3, col=1)


with open(Path(__file__).parent / "surface_data.csv") as file:
    surface_data = list(csv.reader(file.read().split("\n")[:-1]))
surface_data = np.array(surface_data, dtype=float)
fig.add_trace(go.Surface(
    z=surface_data,
    contours=dict(z=dict(show=True, usecolormap=True)),
    colorscale=carnival_colorscale,
    showscale=False
), row=3, col=2)
fig.update_layout(scene=dict(
    xaxis=dict(showticklabels=False, title=""),
    yaxis=dict(showticklabels=False, title=""),
    zaxis=dict(showticklabels=False, title="")
))
restyle.append("colorscale")

fig.add_trace(go.Choropleth(
    locations=locations,
    z=gdppercapita,
    colorscale=carnival_colorscale,
    colorbar=go.choropleth.ColorBar(x=1.1, y=1, yanchor="top", tickvals=[], len=0.4)
), row=4, col=1)
restyle.append("colorscale")

# This is just a dummy trace to display the discrete palette as a colorbar
fig.add_trace(go.Scatter(
    x=[None],
    y=[None],
    mode='markers',
    marker_colorscale=Grad(carnival, discrete=True).to_plotly_colorscale(),
    marker_showscale=True,
    marker_colorbar=go.scatter.marker.ColorBar(y=1, yanchor="top", tickvals=[], len=0.4),
    showlegend=False
))
restyle.append("discrete_colorscale")

fig.update_xaxes(showticklabels=False)
fig.update_yaxes(showticklabels=False)
fig.update_layout(mapbox_zoom=8,
                  width=700,
                  height=1300)

buttons = []
for pal_name, pal in palettes.items():
    restyle_dict = {
        "marker.color": [None] * len(fig.data),
        "marker.colorscale": [None] * len(fig.data),
        "marker.colorbar": [None] * len(fig.data),
        "line.color": [None] * len(fig.data),
        "colorscale": [None] * len(fig.data),
        "visible": [True] * len(fig.data)
    }
    for i, trace in enumerate(fig.data):
        if restyle[i] == "dynamic_categ":
            color_index = int(i / 2)
            if color_index >= len(pal):
                restyle_dict["visible"][i] = False
            else:
                restyle_dict["marker.color"][i] = pal[color_index]
                restyle_dict["line.color"][i] = pal[color_index]
        elif restyle[i] == "static_categ":
            restyle_dict["marker.color"][i] = np.random.choice(np.array(pal), size=len(pop))
        elif restyle[i] == "colorscale":
            restyle_dict["colorscale"][i] = Grad(pal).to_plotly_colorscale()
        elif restyle[i] == "discrete_colorscale":
            restyle_dict["marker.colorscale"][i] = Grad(pal, discrete=True).to_plotly_colorscale()
            restyle_dict["marker.colorbar"][i] = go.scatter.marker.ColorBar(y=1, yanchor="top", tickvals=[], len=0.4)
    buttons.append(go.layout.updatemenu.Button(
        label=pal_name,
        method="restyle",
        args=[restyle_dict]
    ))

fig.update_layout(
    updatemenus=[
        go.layout.Updatemenu(
            buttons=buttons,
            type='dropdown',
            direction='down',
            x=0.4, y=1.1,
            showactive=True,
            active=list(palettes).index("carnival")
        ),
        go.layout.Updatemenu(
            buttons=[
                go.layout.updatemenu.Button(
                    # We have to index with the key because of some lazy access magic plotly implements
                    args=[{"template": plotly_templates[template]}],
                    label=template,
                    method="relayout"
                ) for template in sorted(plotly_templates)
            ],
            type='dropdown',
            direction='down',
            x=0.8, y=1.1,
            showactive=True,
            active=sorted(plotly_templates).index("plotly")
        ),
    ],
    annotations=[
        go.layout.Annotation(
            text="Palette:",
            font=dict(size=12),
            x=0,
            y=1.1,
            xref="paper",
            yref="paper",
            showarrow=False
        ),
        go.layout.Annotation(
            text="Template:",
            font=dict(size=12),
            x=0.55,
            y=1.1,
            xanchor="right",
            xref="paper",
            yref="paper",
            showarrow=False
        ),
    ]
)
fig.show("browser")
Color Picker with Tkinter
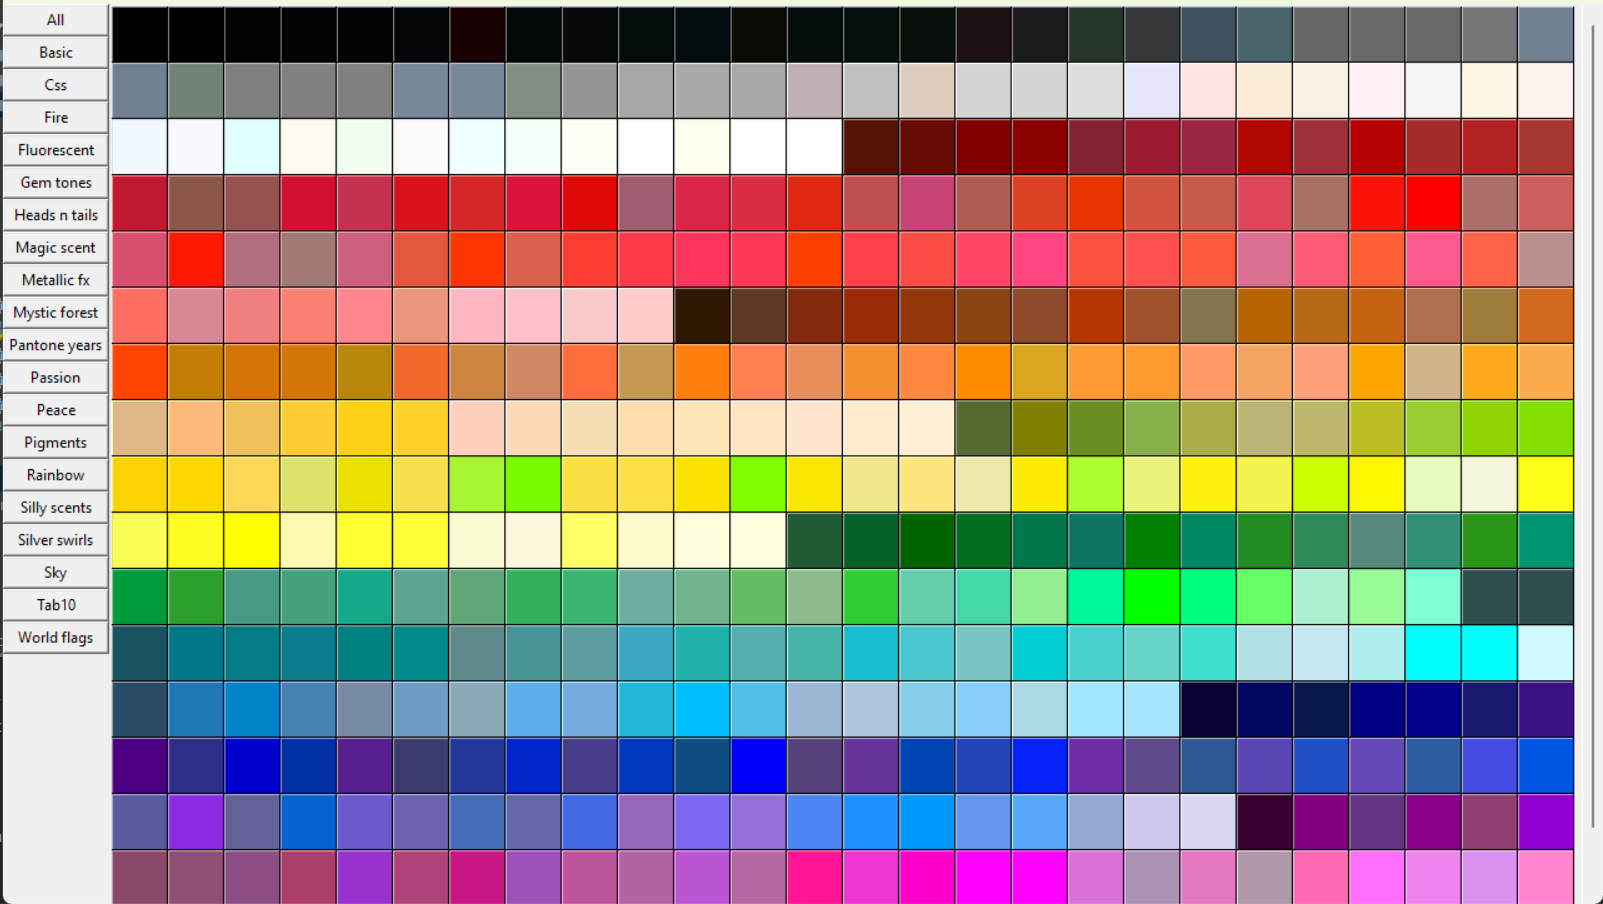
A simple color picker that shows all the palettes available on our current directory (+ the built-in palettes) and copies the names of a color to the clipboard when we click on it.
Just like with any other example, the color picker can be executed with:
$ python -m colorir color_picker
import tkinter as tk
from functools import partial
from colorir import Palette, find_palettes
from colorir.utils import hue_sort_key

colors = Palette.load(palettes_dir=".")
palettes = {"all": colors}
palettes.update({
    pal_name: Palette.load(pal_name, palettes_dir=".")
    for pal_name in find_palettes(palettes_dir=".", kind=Palette)
})


class Window(tk.Tk):
    def __init__(self):
        super().__init__()
        self.geometry('1280x720')
        self.resizable(False, True)

        self.pal_btns = tk.Frame(self)
        self.pal_btns.pack(side=tk.LEFT, fill=tk.Y)
        for pal_name, palette in palettes.items():
            pal_name = pal_name.capitalize().replace('_', ' ') if pal_name.islower() else pal_name
            btn = tk.Button(self.pal_btns,
                            text=pal_name,
                            command=partial(self.add_color_btns, palette.color_names))
            btn.pack(fill='x')
        self.canvas = tk.Canvas(self)
        self.canvas.pack(side=tk.LEFT, expand=True, fill=tk.BOTH)
        scrollbar = tk.Scrollbar(self, orient=tk.VERTICAL, command=self.canvas.yview)
        scrollbar.pack(side=tk.RIGHT, fill=tk.Y)
        self.canvas.configure(yscrollcommand=scrollbar.set)
        self.canvas.bind('<Configure>', lambda e: self.canvas.configure(
            scrollregion=self.canvas.bbox('all')
        ))
        frame = tk.Frame(self.canvas)
        self.canvas.create_window((0, 0), window=frame, anchor='nw')

        self.btn_size = 45
        # Create a button for each available color
        self.color_btns = {name: FramedButton(
            frame,
            width=self.btn_size,
            height=self.btn_size,
            bg=colors.get(name),  # Background of the button is its color
            bd=1,
            command=partial(self.btn_command, name)
        ) for name in colors.color_names}
        self.update()
        self.add_color_btns(colors.color_names)

    def btn_command(self, name):
        # Adds a strip of the selected color to the left of the screen
        self.pal_btns.config(bg=colors.get(name))
        self.clipboard_clear()
        self.clipboard_append(name)

    def add_color_btns(self, c_names):
        for btn in self.color_btns.values():
            btn.grid_forget()
        row = 0
        col = 0
        for c_name in sorted(c_names, key=lambda name: hue_sort_key(8)(colors.get(name))):
            self.color_btns[c_name].grid(row=row, column=col)
            if (col + 2) * self.btn_size < self.canvas.winfo_width():
                col += 1
            else:
                col = 0
                row += 1
        self.update_idletasks()
        self.canvas.configure(scrollregion=self.canvas.bbox('all'))


class FramedButton(tk.Frame):
    def __init__(self, parent, width, height, *args, **kwargs):
        super().__init__(parent, width=width, height=height)
        self.pack_propagate(False)
        self.button = tk.Button(self, *args, **kwargs)
        self.button.pack(fill=tk.BOTH, expand=1)


win = Window()
win.mainloop()